![]()
February 2025
| Model | SWAN 41.31 |
| Period | Jan 2015 - Jan 2025 |
| Spatial resolution | 0.01 degree (King Island), 0.001 degree (Grassy) |
| Temporal resolution | 1 hourly |
| Region | 143.6E - 144.4E, 40.4S - 39.4S |
| Forcings | ERA5 winds, Glorys/TPXO9 currents, and Oceanum spectra |
The King Island wave hindcast dataset provides a detailed account of ocean wave parameters around King Island in western Bass Strait (Figure 1). Wave spectra are computed over a 10-year period between 2015 and 2025 using the SWAN (Simulating WAves Nearshore) third-generation spectral wave model. The model is driven by inputs from the Oceanum Bass Strait Wave Model for spectral boundaries and ERA5 reanalysis winds from the European Centre for Medium-Range Weather Forecasts. Wave-current interactions are included through coupling with ocean currents from Glorys reanalysis and tidal currents from the TPXO9 atlas. Bathymetry is derived from the Bass Strait high-resolution depth model 30m grid from Geosciences Australia.
The modelling setup employs the ST6 source term parameterisations. Spectra are discretised into 36 directional bins and 32 frequency bins, covering a frequency range from 0.037 to 0.7102 Hz with 10% logarithmic increments. The parent domain features a regular grid with 1 km (0.01 degree) resolution covering King Island and surrounding waters. A higher-resolution nested domain provides detailed wave information for the Grassy harbour area:
The dataset provides hourly estimates for an extensive array of ocean wave parameters (Table 2) including spectral quantities integrated over the full spectrum and for spectral partitions (defined from an 8-second split and from the Watershed method). These data are stored over the entire grid at native resolution. Additionally, frequency-direction wave spectra are available at 119 sites for King Island and 168 sites for Grassy (see Figure 1).
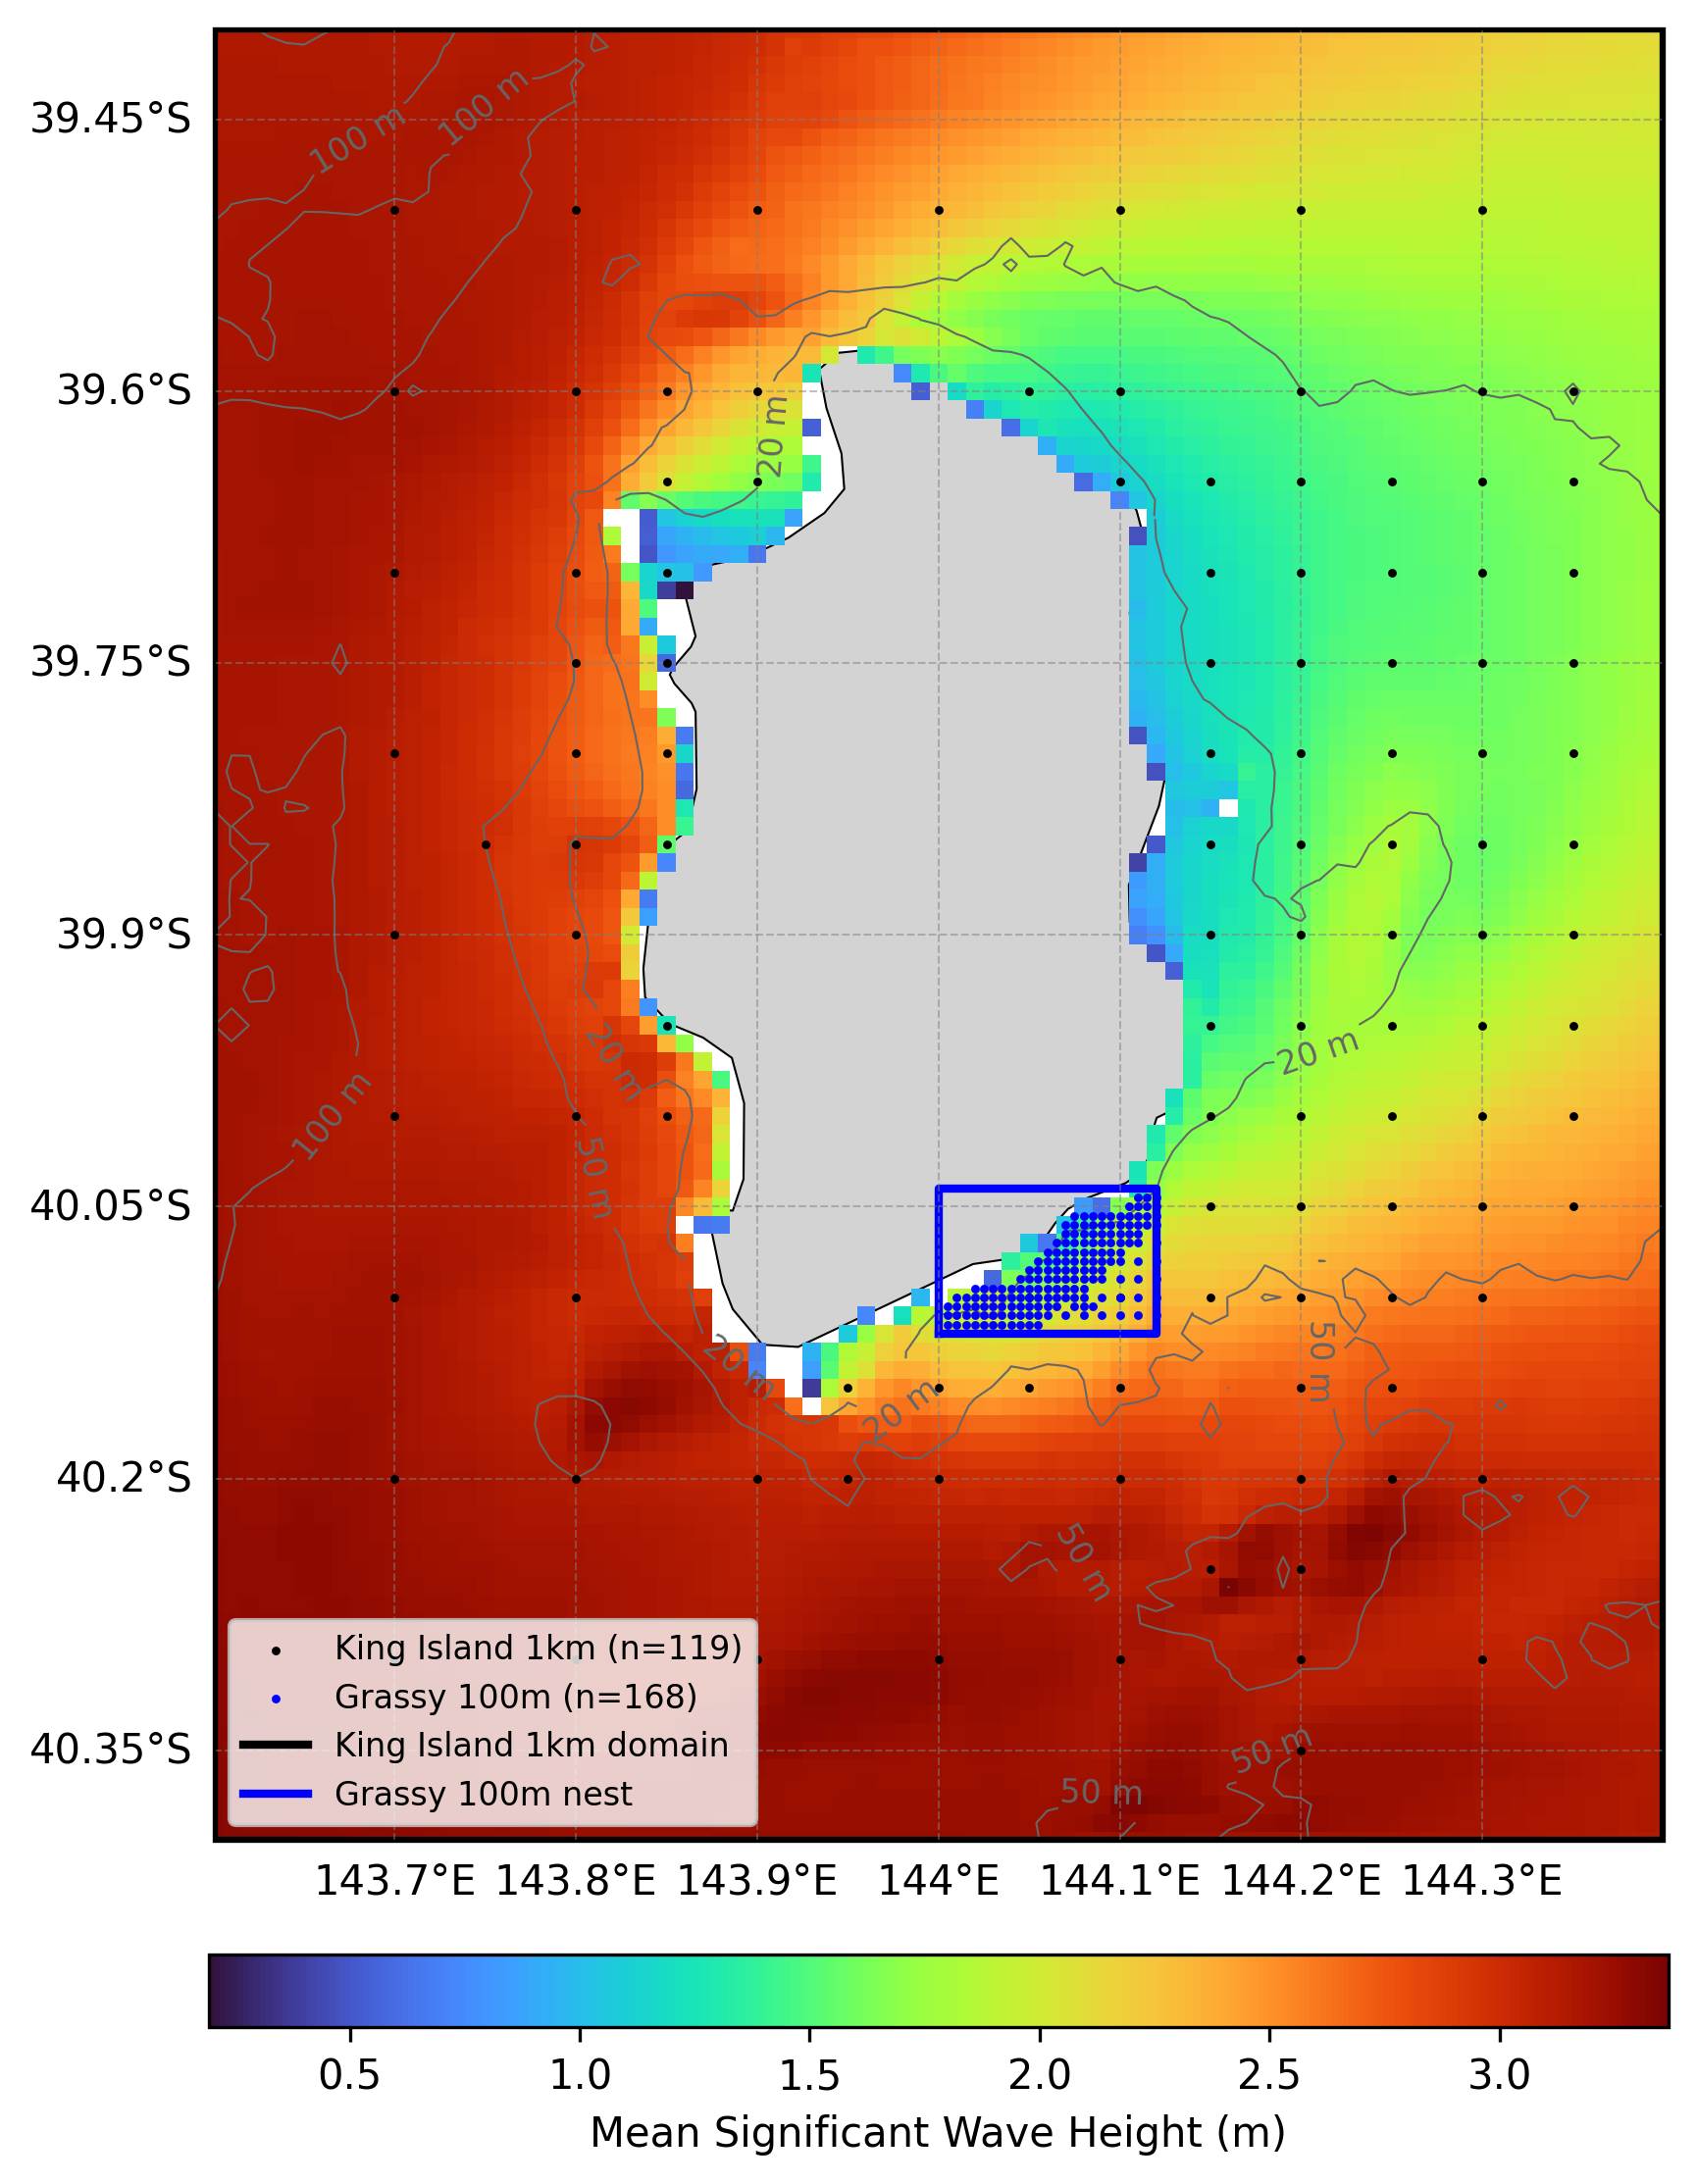
Figure 1. Mean significant wave height from the King Island hindcast domain. The locations of 2D spectra hourly output are shown by the dots. The black box indicates the King Island 1km domain extent, and the blue box indicates the Grassy 100m nest. Depth contours are shown at 20m, 50m, 100m, and 200m.
The wave hindcast can be validated against satellite altimeter observations using the Oceanum Hindcast Satellite Validation App. This interactive tool allows users to compare modelled significant wave height against satellite altimeter measurements at any location within the model domain, providing density scatter plots, quantile comparisons, and statistical metrics.
Table 1. Data description.
| Field | Value |
|---|---|
| Title | Oceanum King Island wave hindcast |
| Institution | Oceanum |
| Access | Oceanum Datamesh |
| Source | SWAN 41.31A |
| Source terms | ST6 |
| Temporal coverage | 2015-01-01 to 2025-01-01 |
| Temporal resolution | Hourly |
| Spatial coverage (King Island) | [143.6E, 40.4S, 144.4E, 39.4S] at 0.01 degree |
| Spatial coverage (Grassy) | [144E, 40.12S, 144.12E, 40.04S] at 0.001 degree |
| Spectra output sites (King Island) | 119 |
| Spectra output sites (Grassy) | 168 |
| Frequency discretisation | 32 frequencies between 0.037 - 0.7102 Hz at 10% logarithmic increments |
| Direction resolution | 10 deg |
| Bathymetry | Bass Strait high-resolution depth model 30m |
| Winds | ERA5 Reanalysis |
| Currents | Glorys Reanalysis + TPXO9 Tides |
| Boundary | Oceanum Bass Strait 5km hourly wave spectra |
Integrated wave parameters are stored hourly over the domain at the native model resolution. Table 2 describes long names and units of all 39 gridded output parameters.
Table 2. Gridded output parameters.
Variable names link to the corresponding NERC Vocabulary Server standard name where available. All parameters are defined on the time, latitude and longitude coordinates.
| Variable | Long Name | Units |
|---|---|---|
| depth | depth below sea surface | m |
| dpm | mean direction at the spectral peak of wind and swell waves | degree |
| dpmsea | mean direction at the spectral peak of wind waves below 8 seconds period | degree |
| dpmswe | mean direction at the spectral peak of swell waves above 8 seconds period | degree |
| dspr | directional spreading of wind and swell waves | degree |
| fspr | normalised width of the frequency spectrum of wind and swell waves | - |
| hs | significant height of wind and swell waves | m |
| hsea | significant height of wind waves under 8 seconds period | m |
| hswe | significant height of swell waves above 8 seconds period | m |
| pdir0 | directional spreading of wind waves | degree |
| pdir1 | directional spreading of primary swell waves | degree |
| pdir2 | directional spreading of secondary swell waves | degree |
| pdir3 | directional spreading of tertiary swell waves | degree |
| pdspr0 | directional spreading of wind waves | degree |
| pdspr1 | directional spreading of primary swell waves | degree |
| pdspr2 | directional spreading of secondary swell waves | degree |
| pdspr3 | directional spreading of tertiary swell waves | degree |
| phs0 | sea surface wind wave significant height | m |
| phs1 | sea surface primary swell wave significant height | m |
| phs2 | sea surface secondary swell wave significant height | m |
| phs3 | sea surface tertiary swell wave significant height | m |
| ptp0 | sea surface wind wave period at variance spectral density maximum | s |
| ptp1 | sea surface primary swell wave period at variance spectral density maximum | s |
| ptp2 | sea surface secondary swell wave period at variance spectral density maximum | s |
| ptp3 | sea surface tertiary swell wave period at variance spectral density maximum | s |
| pwlen0 | mean wavelength of wind waves | m |
| pwlen1 | mean wavelength of primary swell waves | m |
| pwlen2 | mean wavelength of secondary swell waves | m |
| pwlen3 | mean wavelength of tertiary swell waves | m |
| tm01 | mean absolute wave period of wind and swell waves from the first frequency moment | s |
| tm02 | mean absolute wave period of wind and swell waves from the second frequency moment | s |
| tps | smooth relative peak wave period of wind and swell waves | s |
| tpssea | smooth relative peak wave period of wind waves below 8 seconds period | s |
| tpsswe | smooth relative peak wave period of swell waves above 8 seconds period | s |
| ucur | eastward component of current velocity | m/s |
| vcur | northward component of current velocity | m/s |
| xwnd | eastward component of wind velocity | m/s |
| ywnd | northward component of wind velocity | m/s |
Frequency-direction wave spectra are stored hourly at the spectra output sites within the domain. Table 3 describes the spectra output variables, using the exact variable names served by Datamesh.
Table 3. Spectra output variables.
Variable names link to the corresponding NERC Vocabulary Server standard name where available. Spectra are defined on the time, site, freq and dir coordinates; lon and lat are per-site data variables giving each site’s location.
| Variable | Long Name | Units |
|---|---|---|
| efth | sea surface wave variance spectral density | m² s / deg |
| dpt | water depth | m |
| wspd | wind speed | m/s |
| wdir | wind direction | degree |
| lat | latitude | degrees_north |
| lon | longitude | degrees_east |
www.oceanum.science