![]()
February 2025
| Model | SWAN 41.31 |
| Period | Feb 1979 - Updating |
| Spatial resolution | 5 km (0.05 degree) |
| Temporal resolution | 1 hourly |
| Region | 11W - 13E, 48.5N - 61N |
| Forcings | NORA3 winds, tidal currents/levels, and Oceanum spectra |
The Western Europe NORA3 wave hindcast dataset provides a detailed account of ocean wave parameters across the waters of northwestern Europe (Figure 1). The domain encompasses the North Sea, Irish Sea, Celtic Sea, English Channel, and the northeastern Atlantic waters off the coasts of Ireland, the United Kingdom, France, Belgium, the Netherlands, Germany, Denmark, and Norway. This region experiences a complex wave climate influenced by Atlantic swell, extratropical cyclones, and the interaction between open ocean and semi-enclosed seas. Wave spectra are computed over a 45+ year period between 1979 and present using the SWAN (Simulating WAves Nearshore) third-generation spectral wave model.
This hindcast is distinguished by its use of the high-resolution NORA3 reanalysis winds from the Norwegian Meteorological Institute, which provides superior representation of coastal wind patterns compared to global reanalyses. The model also includes wave-current and wave-level interactions through coupling with tidal currents and water levels from the Oceanum Global Tide model. Spectral boundaries are provided by the Oceanum Global Wave Model. Bathymetry is derived from the GEBCO 2023 global bathymetric grid.
The modelling setup employs the ST6 source term parameterisations. Spectra are discretised into 36 directional bins and 32 frequency bins, covering a frequency range from 0.037 to 0.71 Hz with 10% logarithmic increments. The model features a regular grid with a 5 km (0.05 degree) resolution, providing detailed wave information for the Western European coastal region.
The dataset provides hourly estimates for an extensive array of ocean wave parameters (Table 2) including spectral quantities integrated over the full spectrum and for spectral partitions. Partitions are defined from an 8-second split (sea/swell) and from the Watershed method, which identifies one wind-forced partition and up to three swell partitions. These data are stored over the entire grid at native resolution. Additionally, frequency-direction wave spectra are available at 5739 sites distributed across the domain (see Figure 1).
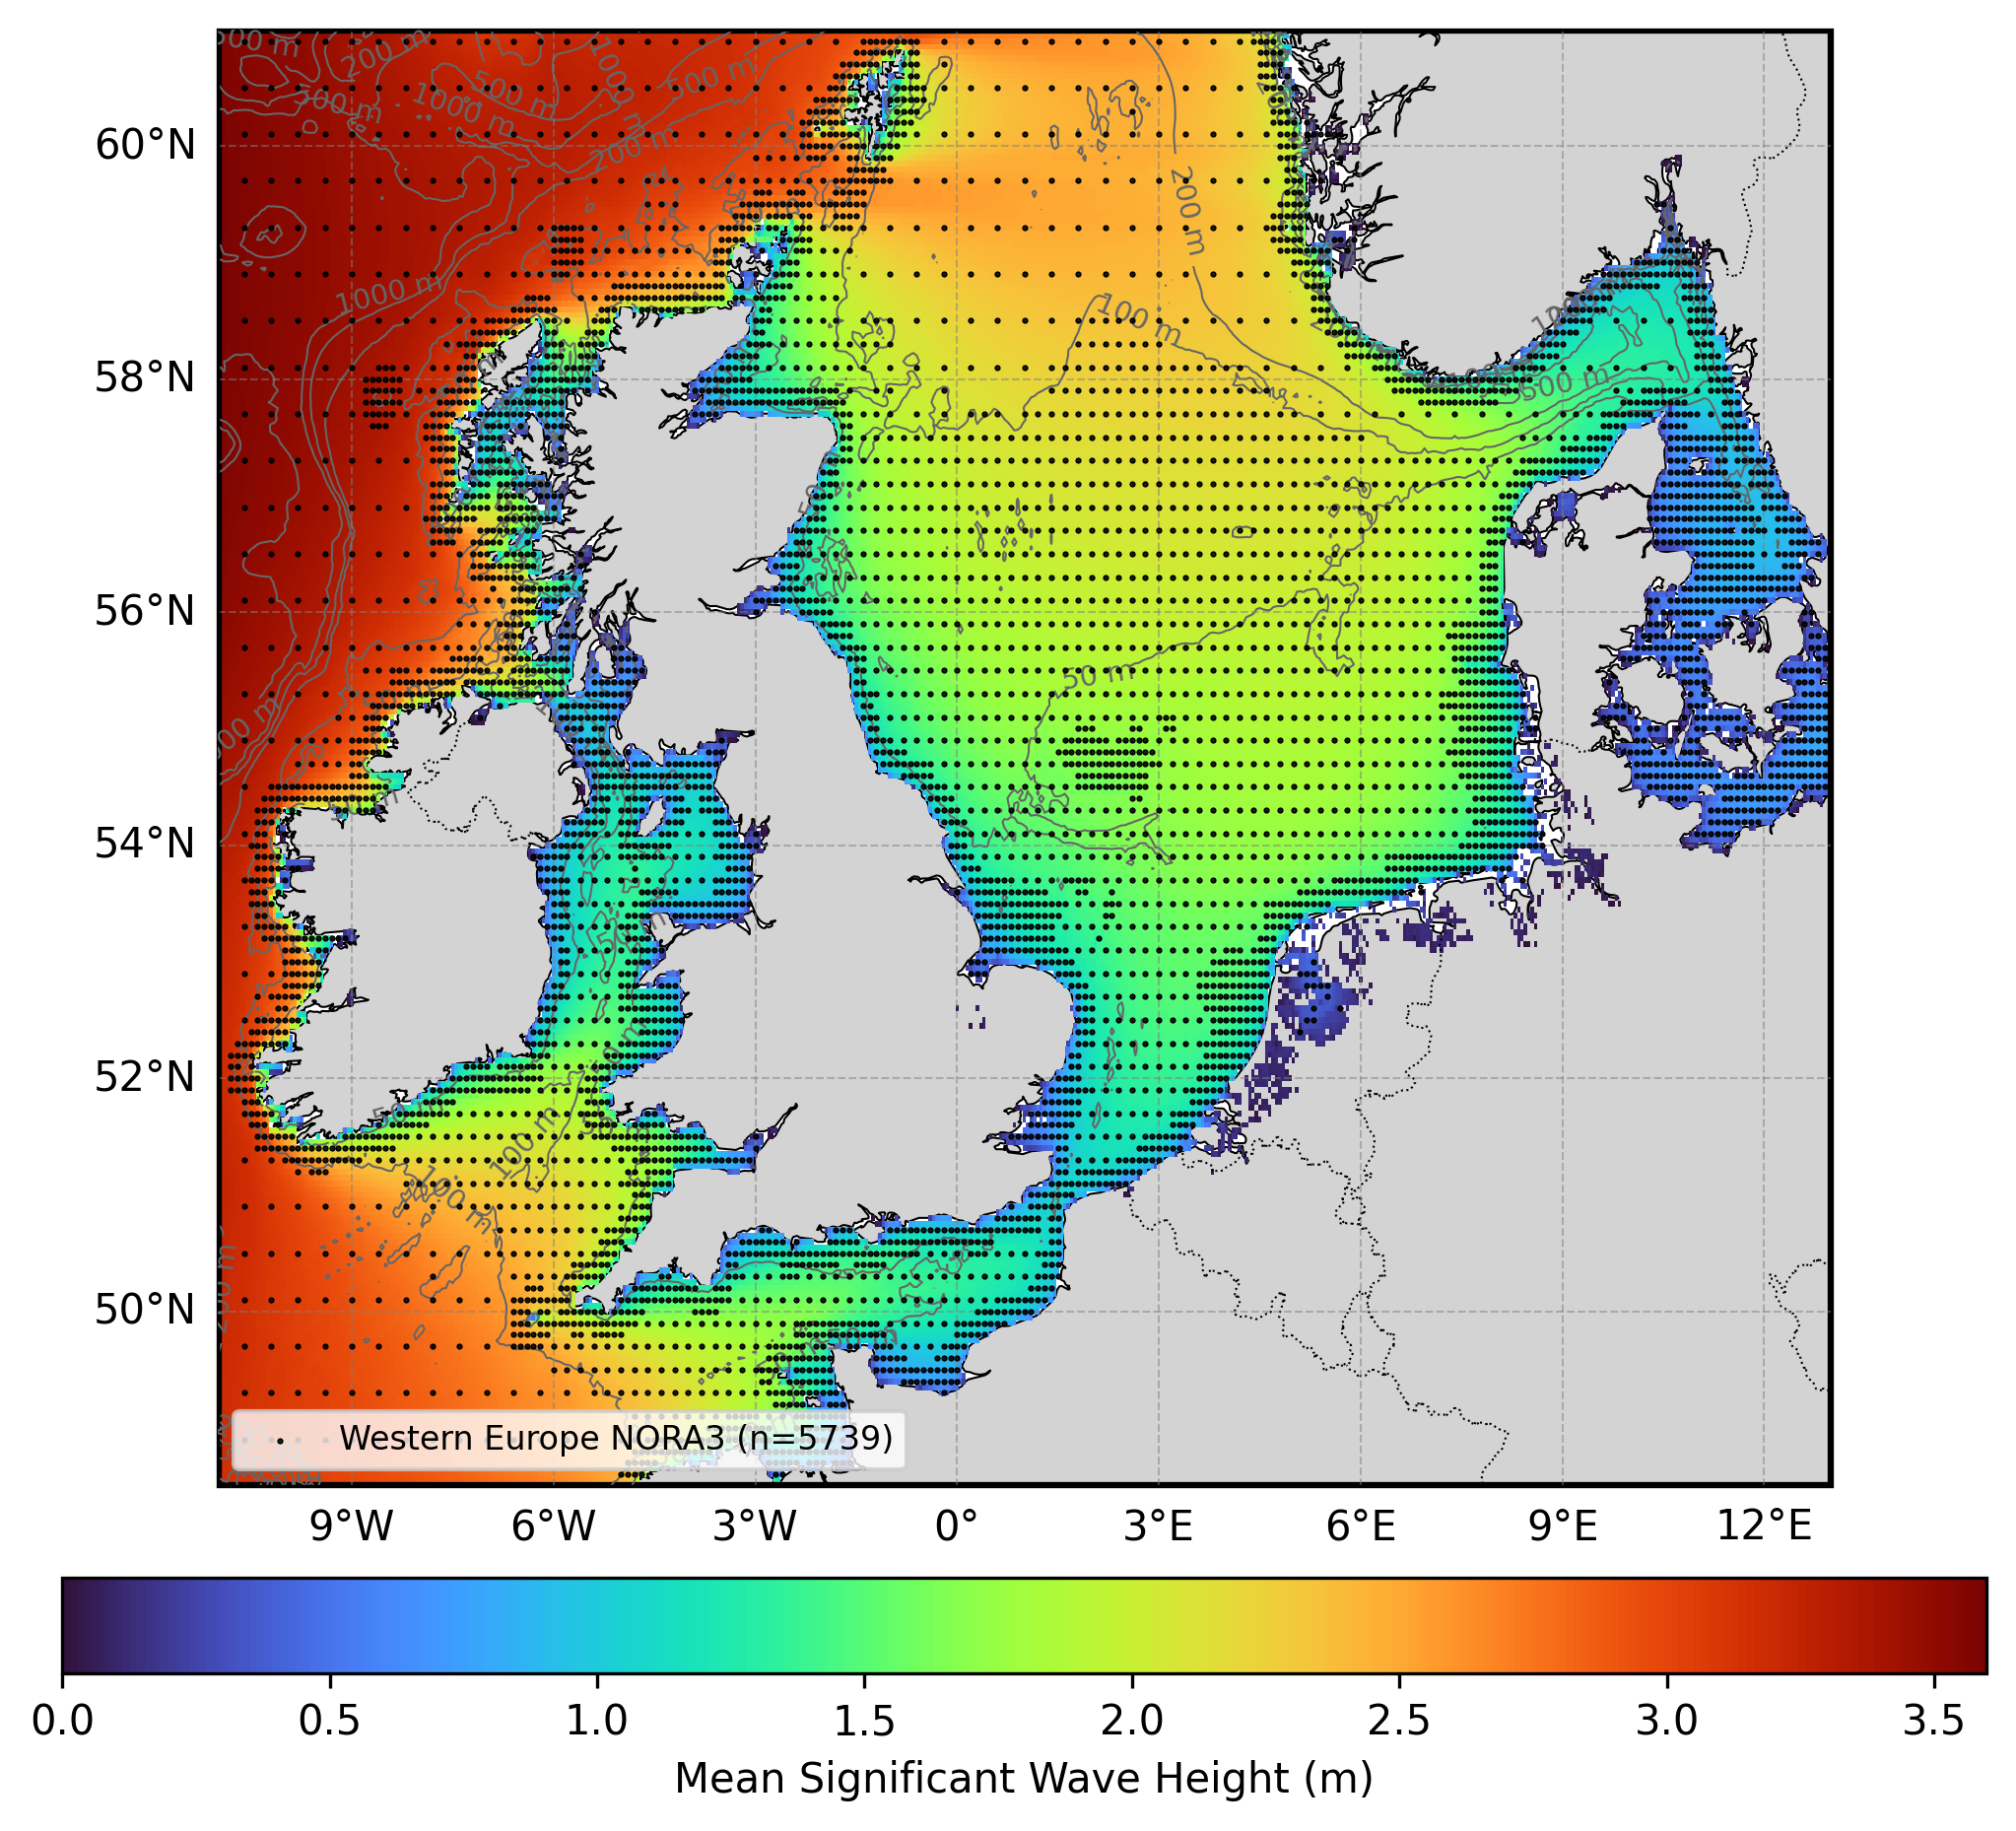
Figure 1. Mean significant wave height from the Western Europe NORA3 hindcast domain. The locations of 2D spectra hourly output are shown by the black dots. Depth contours are shown at 50m, 100m, 200m, 500m, 1000m, and 2000m.
The wave hindcast can be validated against satellite altimeter observations using the Oceanum Hindcast Satellite Validation App. This interactive tool allows users to compare modelled significant wave height against satellite altimeter measurements at any location within the model domain, providing density scatter plots, quantile comparisons, and statistical metrics.
Table 1. Data description.
| Field | Value |
|---|---|
| Title | Oceanum Western Europe NORA3 wave hindcast |
| Institution | Oceanum |
| Access | Oceanum Datamesh |
| Source | SWAN 41.31A |
| Source terms | ST6 |
| Temporal coverage | 1979-02-01 to present (updating) |
| Temporal resolution | 1 hourly |
| Spatial coverage | [11W, 48.5N, 13E, 61N] at 0.05 degree |
| Spectra output sites | 5739 |
| Frequency discretisation | 32 frequencies between 0.037 - 0.71 Hz at 10% logarithmic increments |
| Direction resolution | 10 deg |
| Bathymetry | GEBCO 2023 Grid |
| Winds | NORA3 Reanalysis (with ERA5 gap-filling) |
| Currents | Oceanum Global Tide (tidal currents) |
| Water levels | Oceanum Global Tide (tidal levels) |
| Boundary | Oceanum Global WW3 ERA5 hourly wave spectra |
Integrated wave parameters are stored hourly over the domain at the native model resolution. Table 2 describes long names and units of the 40 gridded output parameters, including one wind-forced partition and three swell partitions from the Watershed method.
Table 2. Gridded output parameters.
Variable names link to the corresponding NERC Vocabulary Server standard name where available. All parameters are defined on the time, latitude and longitude coordinates.
| Variable | Long Name | Units |
|---|---|---|
| botlev | bottom level below mean sea level | m |
| depth | depth below sea surface | m |
| dpm | mean direction at the spectral peak of wind and swell waves | degree |
| dpmsea | mean direction at the spectral peak of wind waves below 8 seconds period | degree |
| dpmswe | mean direction at the spectral peak of swell waves above 8 seconds period | degree |
| dspr | directional spreading of wind and swell waves | degree |
| fspr | normalised width of the frequency spectrum of wind and swell waves | - |
| hs | significant height of wind and swell waves | m |
| hsea | significant height of wind waves under 8 seconds period | m |
| hswe | significant height of swell waves above 8 seconds period | m |
| pdir0 | mean direction of wind waves (partition 0) | degree |
| pdir1 | mean direction of primary swell waves (partition 1) | degree |
| pdir2 | mean direction of secondary swell waves (partition 2) | degree |
| pdir3 | mean direction of tertiary swell waves (partition 3) | degree |
| pdspr0 | directional spreading of wind waves (partition 0) | degree |
| pdspr1 | directional spreading of primary swell waves (partition 1) | degree |
| pdspr2 | directional spreading of secondary swell waves (partition 2) | degree |
| pdspr3 | directional spreading of tertiary swell waves (partition 3) | degree |
| phs0 | significant height of wind waves (partition 0) | m |
| phs1 | significant height of primary swell waves (partition 1) | m |
| phs2 | significant height of secondary swell waves (partition 2) | m |
| phs3 | significant height of tertiary swell waves (partition 3) | m |
| ptp0 | peak period of wind waves (partition 0) | s |
| ptp1 | peak period of primary swell waves (partition 1) | s |
| ptp2 | peak period of secondary swell waves (partition 2) | s |
| ptp3 | peak period of tertiary swell waves (partition 3) | s |
| pwlen0 | mean wavelength of wind waves (partition 0) | m |
| pwlen1 | mean wavelength of primary swell waves (partition 1) | m |
| pwlen2 | mean wavelength of secondary swell waves (partition 2) | m |
| pwlen3 | mean wavelength of tertiary swell waves (partition 3) | m |
| tm01 | mean absolute wave period of wind and swell waves from the first frequency moment | s |
| tm02 | mean absolute wave period of wind and swell waves from the second frequency moment | s |
| tps | smooth relative peak wave period of wind and swell waves | s |
| tpssea | smooth relative peak wave period of wind waves below 8 seconds period | s |
| tpsswe | smooth relative peak wave period of swell waves above 8 seconds period | s |
| ucur | eastward component of current velocity | m/s |
| vcur | northward component of current velocity | m/s |
| xwnd | eastward component of wind velocity | m/s |
| ywnd | northward component of wind velocity | m/s |
Frequency-direction wave spectra are stored hourly at the spectra output sites within the domain. Table 3 describes the spectra output variables, using the exact variable names served by Datamesh.
Table 3. Spectra output variables.
Variable names link to the corresponding NERC Vocabulary Server standard name where available. Spectra are defined on the time, site, freq and dir coordinates; lon and lat are per-site data variables giving each site’s location.
| Variable | Long Name | Units |
|---|---|---|
| efth | sea surface wave variance spectral density | m² s / deg |
| dpt | water depth | m |
| wspd | wind speed | m/s |
| wdir | wind direction | degree |
| lat | latitude | degrees_north |
| lon | longitude | degrees_east |
www.oceanum.science